
An investigation of the immigration opportunities within the UK’s Northern Powerhouse for Entrepreneurs, Individuals, and Families. Part one of a new series looking at the UK
Author: David Blakeman – Managing Partner -Eastwood Global Business Migration Group
Date: 30th April 2019 – Manosque France


Lorem ipsum dolor sit amet, consectetur adipiscing elit.


![]()
Eastwood Global Business Migration Group
Why not seek out your opportunities for immigration with us. We offer the complete Migration Service for the Entrepreneur from Visa’s to Business plans, market assessments, finding the right location for your business and much, much more. If you are seeking employment we can help you assess the opportunities available and point you in the right direction. If you are a family we can help in locating the right home and schools.
All information provided in this blog is advisory and can rely on the third-party source., Over time it will become dated and immigration possibilities will change. So you are strongly advised to make your own checks before taking any action based on any information provided within it.
Introduction
If you are looking for a quick run down on the UK and it’s economy visit our UK Business Page
https://egbmg.com/services/business-in-the-uk/
If you want to check out UK Visa regulations visit our UK Visas page
https://egbmg.com/services/united-kingdom-business-visas/
The Northern Powerhouse
The Northern Powerhouse UK
When one thinks of the UK and business one’s thoughts immediately turn to London and the South East of England. That has not always been the case. The UK has great northern cities and towns that used to power and manufacture the goods and services of an empire. The 20th Century brought many of them to their knees as the industry changed and markets and manufacturing moved elsewhere.

Angel of the North, Northern Powerhouse
However, the advent of the 21st century, high tech and the internet, combined with an educated and flexible workforce has led to a revival of interest in the potential these cities and towns. Interest is growing fast in what they have to offer industries and businesses of the future.
As we shall explore, they also offer an attractive relatively cheap lifestyle to potential employers, their families and their workforces. The countryside surrounding these towns and cities is an asset often overlooked, it is surprisingly unspoiled by the industrialization of the last two centuries and full of wild and attractive places ideal for family life and leisure activities. Yet these same places are close enough to the centers of industry and business to make a reasonable commute. The area also contains universities with a global standing and has a continued history of providing a home to leading-edge research and development across a number of sectors.

Northern Powerhouse, North East England, UK
If you are thinking about breaking into European markets or building a business that serves a global market this ‘Northern Powerhouse’ is well worth consideration. Whatever happens with BREXIT you can be sure that one thing will be guaranteed ‘Favourable access to European Markets’. When you strip away all the noise surrounding Brexit it is in in the absolute interest of both sides to ensure this happens, to paraphrase President Clinton ‘it’s economics stupid’.
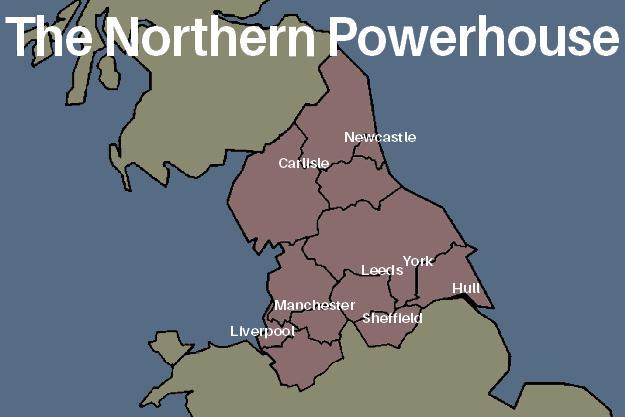
the Northern Powerhouse is made up of the city regions of:
- Liverpool;
- Manchester;
- Leeds;
- Sheffield;
- Hull; and the
- North East (Including Newcastle and Carlile).
Or to put it another way, Liverpool City Region Combined Authority; Greater Manchester Combined Authority; West Yorkshire Combined Authority; Sheffield Combined Authority; Humber Local Enterprise Partnership; North East Combined Authority.
The idea of a ‘Northern Powerhouse’ was first introduced in June 2014 by the then Chancellor of the Exchequer, George Osborne, in a speech in Manchester. He made the case that the lack of economic and physical connections between the cities and city regions of the North of England was holding back their growth, with significant implications for the national economy. In the Chancellor’s own words: “the whole is less than the sum of its parts…so the powerhouse of London dominates more and more.”
For Osborne, the solution to this challenge was the creation of a Northern Powerhouse – “not one city, but a collection of northern cities – sufficiently close to each other that combined they could take on the world.” Since a raft of interventions have been announced turning the rhetoric of a Northern Powerhouse into a reality – including the Greater Manchester Devolution Deal, Transport for the North, and the Northern Transport Strategy
Northern Powerhouse key facts
- UK population (%) 16.7
- Share of GB jobs, 2013 (%) 16.0
- Share of total UK GVA, 2013 (%) 13.3
- Share of jobs that are knowledge-intensive, 2013 (%) 12.7
- Number of universities 23
Population
The Northern Powerhouse area is home to 10.7 million people, a quarter of whom live in the Manchester City Region, and 21 percent in West Yorkshire Combined Authority. Over the 10 year period, 1991 – 2001 the Northern Powerhouse had far slower population growth than the rest of the UK. Between 2004 and 2013, London’s population grew more than twice as fast as the Northern Powerhouse.
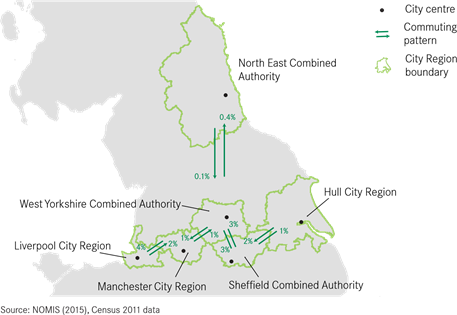
Commuting
The Northern Powerhouse has a high level of containment: 92 percent of people who work in the Northern Powerhouse also live within the Northern Powerhouse, and 96 percent of those working in the North East Combined Authority also live there. 15 percent of people working in Manchester City Region, however, travel in from elsewhere in the Northern Powerhouse or from beyond.
Northern Powerhouse
Economy
The Northern Powerhouse accounts for 13.3 percent of all UK’s Gross Value Added, compared to the 24.5 percent that is contributed by London. Over the 10 year period, 1991 – 2001 the Northern Powerhouse performed below the UK’s average for GVA growth. London outstripped the region, growing nearly twice as fast as the Northern Powerhouse. Looking at GVA output per worker, although there is little difference in productivity between the city regions of the Northern Powerhouse, the average GVA output per worker is £44,850; 13 percent behind the GB average, and 29 percent behind that of London.
Jobs
In 2013 The Northern Powerhouse contained 4.5 million jobs, accounting for 16 percent of all Britain’s jobs. These jobs were not evenly spread across the region; 27 percent of all jobs within the Northern Powerhouse was in Manchester City Region, and 22 percent in West Yorkshire Combined Authority.
Knowledge Intensity
20 percent of all businesses in the Northern Powerhouse can be classed as knowledge-intensive business services (KIBS), in comparison to London, where knowledge-intensive businesses represent over 30 percent of the total business base. The same is true of jobs in KIBS. 12.7 percent of all jobs in the Northern Powerhouse are in KIBS – in London, the figure is 24.3 percent. However, significant differences can be observed between the city regions of the Northern Powerhouse – the share of jobs in KIBS in Manchester City Region is more than twice that of Hull City Region.
Skills
The difference in the proportion of KIBS jobs in the Northern Powerhouse compared to London can be partly explained by the skill levels of their respective labor markets. 29 percent of working-age residents in the Northern Powerhouse are high-skilled, the same as Britain’s average; in London, that figure rises to 48 percent.
Research & Development – Universities
The Northern Powerhouse is well catered for by higher education institutions. The region contains 23 universities, six of which rank in the top 20 for research excellence nationally.
The Northern Powerhouse Today
Critical to the development of the Northern Powerhouse is the Northern Powerhouse Partnership (NPP) an independent body that was launched in September 2016 to represent the voice of business and civic leaders across the North of England. The NPP is chaired by the Rt Hon George Osborne who first outlined the Northern Powerhouse concept in a keynote speech in June 2014 and was a key exponent of the vision. The intention of the NPP is to encourage the different areas within the region to work together building greater confidence in what is possible and encouraging innovation through thought-provoking events. They will develop new regional policy ideas to drive the Northern Powerhouse forward. The Rt Hon George Osborne’s international standing and reach has enabled the partnership from its very beginning to look outwards towards global markets and opportunities. This is very much a reignition of a recent historical period, almost in living memory, when businesses from this region very successfully viewed their markets from a global perspective. So the NPP’s aims could be summed up as to improve the north’s quality of life and economy, and promote it as a place to work, study, live and invest.
It’s Priority Areas
It has identified 4 prime economic capabilities – a collection of assets, expertise, and businesses which are pan-Northern, highly productive, and internationally competitive. These will form the core of future economic growth and are:
- Advanced Manufacturing
- Energy
- Health Innovation
- Digital
So if these encompass your area of interest keep reading.
They are underpinned by enabling capabilities in Financial and Professional Services, Logistics and Education.
NPP supports the development of these collective strengths of the northern economy, working with the Government’s Industrial Strategy. Believing the biggest contribution that a partnership of business, local and national government can make to these strengths is by focusing on four key challenges:
1. Infrastructure & Assets
transport, communications, science/science commercialization, cultural assets, housing, and new technology.
2. Education & Skills

Leeds University Language Center
basic skills from schools and the higher/technical level skills needed to drive innovation and growth, along with a world-class university sector.
3. International Competitiveness
enterprise culture, innovation, trade and international investment
4. Leadership & Learning

Northern Powerhouse
leadership within companies, promoting relevant devolution of decision-making powers and supporting civic leaders and Mayors to learn from best practice in the world.
Source: http://www.northernpowerhousepartnership.co.uk/
Major Cities
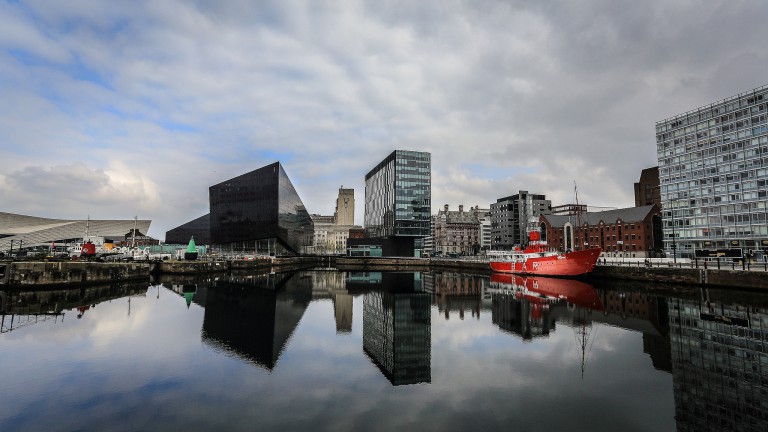
Liverpool


Liverpool Business Associations
The staff at LBA are professional, knowledgeable people but what makes them different is the personal touch they apply. Every small business/ member is known personally and each of us is made to feel special and given so much needed support. The staff happily listen no matter what concerns one has, and truly seem to want your business to succeed.Source: http://www.liverpoolba.com/
Liverpool Business News
Source: https://lbndaily.co.uk/
Liverpool Economy
Liverpool City Region has the highest growth of any Combined Authority area in England, according to new Government data.
Latest Regional Accounts published by the Office for National Statistics (ONS) show a growth rate of 3.3% in 2017 and places the City Region above the England average economic growth rate of 2.0%. Alongside Cheshire & Warrington the City Region is the fastest growing LEP area in the country.
Analysis of the 2017 figures by the Liverpool City Region Local Enterprise Partnership (LEP) show that Gross Value Added (GVA) growth in the City Region has been driven by an increase in output across a number of sectors including manufacturing, health, wholesale & retail, education, construction and information & communications.
Since 2013 GVA from the manufacturing sector in Liverpool City Region has increased by an average 2.1% per year compared to 1.4% for England.
Within the Information & Communications sector the City Region records a stronger growth rate then national average particularly around film and TV productions and computer programming and consultancy.
Commenting on the figures, Liverpool City Region LEP Chair Asif Hamid MBE said: “These figures underline the progress being made to deliver sustainable economic growth in Liverpool City Region. By supporting our strengths in sectors like manufacturing, health and digital and creative we are enabling real, meaningful change in the City Region.
“Our growth sectors and assets provide us with an outstanding environment for growth and the time to invest in the City Region have never been better.”
Liverpool City Region Local Enterprise Board
Liverpool City Region Local Enterprise Partnership (LEP) was created in 2012 to bring together businesses and civic leaders to drive private-sector led growth and job creation. It covers the local authority areas of Liverpool, Halton, Knowsley, St Helens, Wirral and Sefton.
Living in Liverpool
Liverpool is a vibrant, growing city. It’s history, architecture, jobs and welcoming Liverpudlians make it a city where many people relocate and never want to leave. It has the city, the countryside, the beach and, of course, the Beatles.
If you are considering moving to Liverpool, the various costs listed below will help you make an informed decision on what costs are involved.
Quick Liverpool Facts:
- Population: 467,000 (2017 estimate), 2 million in the Liverpool city region.
- Official Language: English (de facto)
- GDP Per Capita: $33,230 USD
- China Town: Liverpool’s China Town is the oldest Chinese community in Europe.
- Currency: Pound Sterling or Great Britain Pound (£, GBP). As of early 2017, $1 USD = £0.80, €1 EUR = £0.85, $1 CAD = £0.61, $1 AUD = £0.62
Moving and Shipping Costs to Liverpool
Below are some sample container shipping costs to Liverpool from other major world cities. Just keep in mind they only reflect the shipping portion of the cost and not the full moving costs.
- London – £127+
- Australia (Sydney) – £2,215+
- Ireland (Dublin) – £229+
- USA (New York City) – £907+
- Canada (Vancouver) – £1,500+
- New Zealand (Auckland) – £2,618+
- Hong Kong – £526+
- Dubai – £1,706+
- Singapore – £830+
Source: WorldFreightRates.com
You can save money by comparing removals companies if moving from within the UK and international moving companies if coming from abroad using our moving quote form above.
Live
rpool Housing Costs
House and flat prices in Liverpool are reasonable compared with other major cities around the globe. Prices obviously vary from area to area but the figures below will give you an indication of what’s available at what price.
Monthly Rental Prices in Liverpool
- 1 bedroom flat (apartment) in City Centre: £450+
- 1 bedroom flat outside the City Centre: £350+
- 3 bedroom flat in City Centre: £700+
- 3 bedroom flat outside the City Centre: £525+
Liverpool Home Purchase Prices
- Price per square metre (10.7 square feet) to buy in City Centre: £3,500+
- Price per square metre (10.7 square feet) to buy outside City: £2,000+
Liverpool Housing Cost Comparison
This is how rents in Liverpool compare with other cities around the globe.
London is 211.56% more expensive
New York is 348.92% more expensive
Los Angeles is 197.82% more expensive
Toronto is 78.25% more expensive
Sydney is 193.78% more expensive
Paris is 88.57% more expensive
Dubai is 228.25% more expensive
Source: Numbeo
Source: https://moverdb.com/moving-to-liverpool/
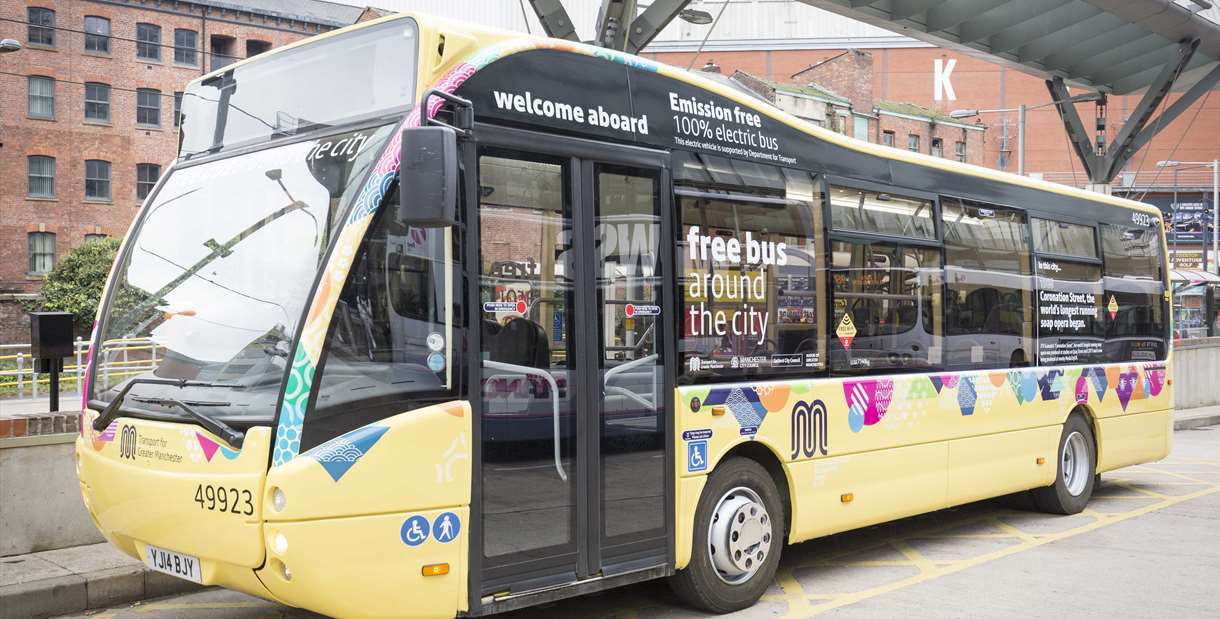
Manchester


Manchester: An Economic Powerhouse
Since the days of the industrial revolution, it has played an important role in shaping the UK’s economy. Today, the region is home to more than 2.8 million people, with an economy bigger than that of Wales or Northern Ireland. Manchester’s business strengths have enabled it to develop a strong reputation as a competitive place to do business.
The ten metropolitan boroughs of Greater Manchester – Bolton, Bury, Manchester, Oldham, Rochdale, Salford, Stockport, Tameside, Trafford, and Wigan – represent the largest city region economy outside London, with a gross value added (GVA) of £62.8 billion. In the decade to 2012, the economy grew by 42% and it has been one of the major UK city-regions driving job growth (84% between 2002-2015*), at twice the rate of jobs growth of the north as a whole.
The ten councils– the first statutory “Combined Authority” in the UK outside London – and our Mayor coordinate key issues such as economic development, regeneration and transport. This governance structure has enabled the region to secure greater powers from central government to shape its own future and success.
Economy at a glance
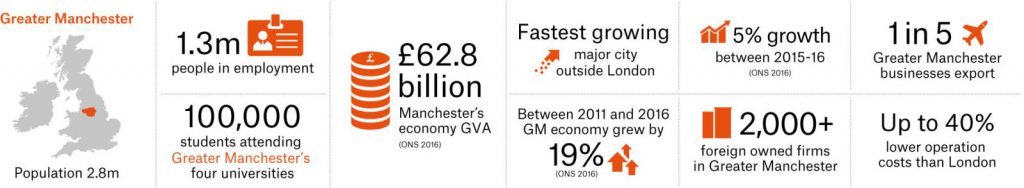
Greater Manchester’s economic growth has been driven by its diverse industry base, which has specialisms in:
• business, finance & professional services
• advanced manufacturing
• life sciences & healthcare innovation
• energy & environment
• creative, digital and technology
It is anticipated that the levels of job creation in Manchester could outpace that of cities such as Berlin, Tokyo and Paris between 2015 and 2020.**
* Centre for Cities 2018
** Beyond the City 2015, Oxford Economics
Source: https://www.investinmanchester.com/why-manchester/economic-overview
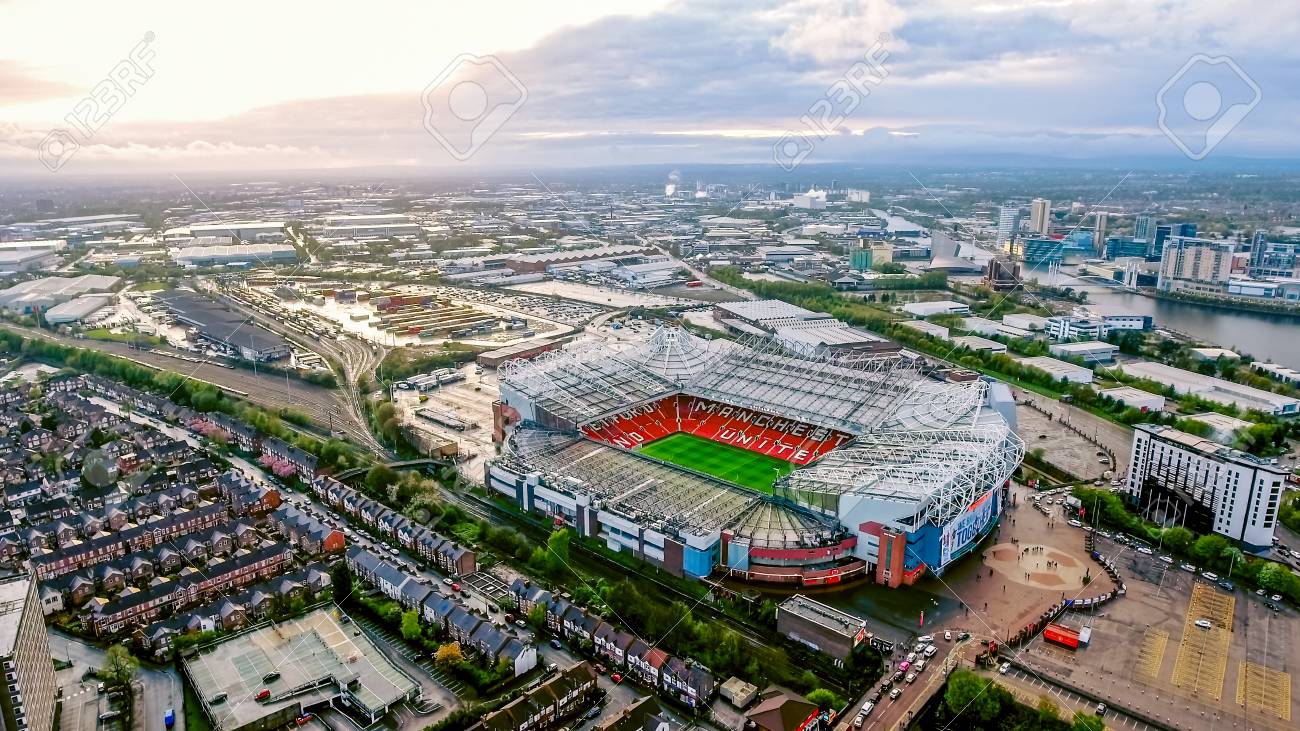
Manchester’s Industries
Welcome to the original business city. Manchester has played a pivotal role in shaping how the world does business.
Birthplace of the Industrial Revolution, establishing the cooperative and free trade movements, Manchester continues to be a great city for industry and innovation and is recognised as one of Europe’s leading business destinations. It is the most successful city for attracting foreign direct investment outside London.
With strengths in research, manufacturing and advanced engineering, life sciences, energy and environment, financial, professional and business services, and creative, digital and technology, Manchester has a world-class offer for the international investor.
Attracting more foreign direct investment in the past decade than any other city outside of London, Manchester is already home to over 2,000 foreign owned companies including Kellogg’s, PZ Cussons, Siemens, BNY Mellon, Google, and Bouygues, Energies & Services.
As the UK’s second largest economy, Manchester is an important economic engine driving the country’s growth and prosperity, and has a GVA of £62.8 billion.
Made up of 10 metropolitan boroughs, Greater Manchester is the UK’s most economically diverse city region. Manchester is at the heart of the Northern Powerhouse. The Northern Powerhouse is the UK government’s strategy to boost the local economies of seven northern cities by investing in skills, innovation, transport and culture, as well as devolving significant powers and budgets.
The city region reached a ground-breaking devolution agreement with the UK Government which saw Manchester become the first place in the UK to gain governance over its economy.
This historic devolution agreement means Manchester has significant powers and responsibilities over its transport, housing, planning, business skills and training, and science and innovation. These powers will enable control of Greater Manchester’s £6 billion National Health Service budget which is a landmark move in UK health and social care policy.
Through the city’s devolution agenda, there will be strong co-investment opportunities particularly around housing, transport and innovation within science and health care.
Contact MIDAS to see how Manchester can support your innovation.
T: +44 (0)161 237 4470
E: info@midas.org.uk
@MIDAS_MCR
Source: https://www.investinmanchester.com/sectors
Living in Manchester
Manchester is an ethnically diverse and thriving city in the north of England. It has a fascinating architectural history and has bred and attracted artists, musicians and celebrities over the centuries.
If you are considering moving to Manchester, the various costs listed below will help you make an informed decision on what costs are involved when moving and living in the UK’s second biggest city.
Quick Manchester Facts:
- Population: 530,300 (2017 estimate). The Greater Manchester area has a population of 2.68 million, making it the second largest city in the UK.
- Official Language: English (de facto) with over 200 languages being spoken in the city, such as Polish, Urdu, Mandarin, Bengali, Punjabi, Gujarati and Arabic.
- GDP Per Capita: $38,658 USD
- Curry Mile: Over the length of just under half a mile, you will find over 70 South East Asian restaurants.
- Currency: Pound Sterling or Great Britain Pound (£, GBP). As of early 2017, $1 USD = £0.80, €1 EUR = £0.85, $1 CAD = £0.61, $1 AUD = £0.62
Moving and Shipping Costs to Manchester
Below are some sample shipping costs to Manchester from other major world cities. Just keep in mind they only reflect the shipping portion of the cost and not the full moving costs.
- London – £120+
- Australia (Sydney) – £2,215+
- Ireland (Dublin) – £229+
- USA (New York City) – £907+
- Canada (Vancouver) – £1,500+
- New Zealand (Auckland) – £2,618+
- Hong Kong – £526+
- Dubai – £1,706+
- Singapore – £830+
Source: WorldFreightRates.com
Manchester Housing Costs
Housing prices in Manchester and cheaper than London but tend to be higher than other cities in the UK. Prices obviously vary from area to area but the figures below will give you an indication of what’s available at what price.
Monthly Rental Prices in Manchester
- 1 bedroom flat (apartment) in City Centre: £500+
- 1 bedroom flat outside the City Centre: £400+
- 3 bedroom flat in City Centre: £850+
- 3 bedroom flat outside the City Centre: £600+
Manchester Home Purchase Prices
- Price per square metre (10.7 square feet) to buy in City Centre: £2,175+
- Price per square metre (10.7 square feet) to buy outside City: £317+
Manchester Housing Cost Comparison
This is how rents in Manchester compare with other cities around the globe.
London is 20.67% more expensive
New York is 265.74% more expensive
Los Angeles is 144.23% more expensive
Toronto is 44.66% more expensive
Sydney is 137.25% more expensive
Paris is 55.82% more expensive
Dubai is 167.47% more expensive
Source: Numbeo
Source: https://moverdb.com/moving-to-manchester/
Leeds


Economic performance and key sectors in Leeds
The Leeds economy is estimated to be worth £21.3 billion per annum and accounts for nearly a third of the Leeds City Region’s total economic output.
Output and productivity
The city’s economy grew by 34% during the last decade, in line with Leeds City Region as a whole. Over the next ten years, the economy is forecast to grow by 21%, with financial and business services set to generate more than half of GVA growth over that period.
Productivity, measured in terms of GVA per full time equivalent employee, is estimated at £51,300 per annum. In terms of productivity per hour worked- the headline measure of economic performance – Leeds recorded the second highest GVA per hour worked of all English core cities at £28.90 per hour.
Business outlook
There were over 32,000 VAT-registered businesses in Leeds, a net increase of 4% in the business stock, with the rate of business formation at 85 per 10,000 head of working age population. (ONS Business Demography).
The Quarterly economic survey carried out by West and North Yorkshire Chamber provides a regular finger on the pulse’ of the region’s economy, with the Quarter 4 survey for 2016 showing an increase in business confidence in all sectors.
Comparative data and analysis of the Leeds economy is available in the Cities Outlook2017, published by independent think tank Centre for Cities.
Key sectors
Growth sectors of the Leeds economy include healthcare and medical technologies, financial and business services, manufacturing, digital and creative, retail, housing and construction, social enterprise and the third sector.
Leeds is the largest centre outside London for financial and business services, digital, creative, publishing and broadcasting. It has the second highest concentration of knowledge intensive jobs and is the third largest manufacturing centre by local authority area.
Within the financial and business service sector, there are 11 subsectors which employ more than 5,000 people, including head office activities, real estate, legal and accounting, computer programming and consultancy.
Skills development
Over 1,350 digital companies are based in Leeds with a combined workforce of around 10,000. The city has the highest number of ‘scale up’ digital companies outside the South East and workers in the sector in Leeds are amongst the highest paid in the UK.
However, vacancy numbers are increasing and there is a danger that demand from employers will outstrip supply. The city needs to retain, attract and develop graduate talent. There also needs to be confidence about the calibre and depth of the talent pool.
We asked a number of employers and education providers how to address some of these issues. The Leeds Digital Skills Action Plan is the result and it sets out actions to improve links between employers and education as well as creating entry points into the digital sector for local, national and international talent.
The plan has been in place since 2016 and was recently featured in the Government’s Digital Strategy, published in 2017, as an example of good practice.
Source: https://www.leeds.gov.uk/business/economic-performance-and-key-sectors
Living in Leeds
Over the centuries, Leeds has grown from a small market town to the UK’s fourth largest city. It is considered to be the UK’s most successful business, financial and legal hub outside London.
If you are considering moving to Leeds, the various costs listed below will help you make an informed decision on what costs are involved when moving and living in the UK’s fourth largest city.
Quick Leeds Facts:
- Population: 782,444 (2017 estimate) in the city of Leeds. The West Yorkshire Urban Area is approximately 1.8 million.
- Official Language: English (de facto). At the last census, 92.9% of people in Leeds spoke English. The second most spoken language was Polish, followed by Urdu, Punjabi, Arabic, Chinese, Bengali, Kurdish, French and Persian/Farsi.
- GDP Per Capita: $51,510.54 USD
- Movies: The world’s first moving picture was made in Leeds in 1888, by French inventor Louis Le Prince.
- Currency: Pound Sterling or Great Britain Pound (£, GBP). As of early 2017, $1 USD = £0.80, €1 EUR = £0.85, $1 CAD = £0.61, $1 AUD = £0.62
Moving and Shipping Costs to Leeds
Below are some sample container shipping costs to Leeds from other major world cities. Just keep in mind they only reflect the shipping portion of the cost and not the full moving costs.
- London – £95+
- Australia (Sydney) – £2,248+
- Ireland (Dublin) – £240+
- USA (New York City) – £877+
- Canada (Vancouver) – £1,498+
- New Zealand (Auckland) – £2,646+
- Hong Kong – £527+
- Dubai – £1,682
- Singapore – £879+
Source: WorldFreightRates.com
Leeds Housing Costs
House prices in Leeds are expensive compared with the rest of northern England but reasonably priced compared with major cities around the globe. There is variety of detached houses, semi-detached and flats available.
Monthly Rental Prices in Leeds
- 1 bedroom flat (apartment) in City Centre: £550+
- 1 bedroom flat outside the City Centre: £400+
- 3 bedroom flat in City Centre: £800+
- 3 bedroom flat outside the City Centre: £500+
Leeds Home Purchase Prices
- Price per square metre (10.7 square feet) to buy in City Centre: £2,175+
- Price per square metre (10.7 square feet) to buy outside City: £1,790+
Leeds Housing Cost Comparison
This is how rents in Leeds compare with other cities around the globe.
London is 165.49% more expensive
New York is 285.43% more expensive
Los Angeles is 155.53% more expensive
Toronto is 53.10% more expensive
Sydney is 151.22% more expensive
Paris is 60.64% more expensive
Dubai is 181.68% more expensive
Source: Numbeo
Source: https://moverdb.com/moving-to-leeds/
Sheffield


Sheffield 2019 – An Economic Powerhouse
Ever since the announcement of the Northern Powerhouse initiative almost four years ago the north of the country has come into increasing focus economically. Manchester and Salford are often seen as leading the way in this regard, but Yorkshire cities such as Leeds and Sheffield are quickly learning the lessons of surrounding areas. Boroughs of Manchester that have seen recent investment have included Salford, Stockport and Bury, with huge projects being undertaken to provide new retail outlets, commercial property, roads and transport links which have so far been seen to boost local jobs, property and the wider economy.
Sheffield looks to be following that blueprint to capitalise on its recent success with Sheffield City Council releasing its next phase of the Sheffield City Master Plan, to be completed by 2019. As the title suggests, Sheffield is joining in the economic revolution of the north.
There is already work underway from the council’s previously announced plans, with the Sheffield Retail Quarter scheme under construction and the work now falls under the Heart of the City remit. There is said to be a focus by the council to provide offices and retail units fit for a changing economy, with attention paid to how the retail world has been transformed by the internet and the council have also made it clear that they’re looking at attracting more premium brands to the area.
Reporting in local media, including The Yorkshire Post, has been largely positive as residents are keen to have developments that would see them rival Manchester and Leeds for retail, property, jobs and culture. The plans are currently thought to need six years to complete but also bring the promise of 7,000 new jobs in the centre, mainly in service industries, which the council see as the future of the city jobs market. Sheffield’s future looks bright and it would be no great surprise to see investors devouring these new opportunities.
A new £90m development is currently under way for a new site for HSBC bank, already one the area’s largest employers. The area highlighted for development under the new plans will include 60,000 square feet of the city centre area between Fargate and The Moor, and will be dubbed Heart of the City 2, following on from recent successes.
Property in Sheffield has been enjoying great success recently, too, with house prices increasing healthily and demand for rental property rising as the economy performs well with more jobs being created. Due to the city hosting two universities it is also understood that more and more post-graduate students are deciding to settle within the city centre area and these new plans to provide more nightlife, shopping and living spaces should see that trend continue.
Developments of residential properties around Sheffield are increasing too with investors keen to get on board early in this next chapter of the northern powerhouse project after the phenomenal success of off-plan projects in Liverpool, Leeds and Manchester.
If you’re interested in investing in Sheffield contact us today to find out more!
https://www.eliterealtyinvest.co.uk/blog/sheffield-2019-an-economic-powerhouse
Living in Sheffield
Sheffield grew as a steel giant in the nineteenth and twentieth centuries. Today, it is a diverse city which offers a lot to the people who live here. Like Rome, it sits on seven hills and is on the edge of the Peak District.
If you are considering moving to Sheffield, the various costs listed below will help you make an informed decision on what costs are involved when moving and living in this vibrant and growing city.
Quick Sheffield Facts:
- Population: 576,664 (2017 estimate). The metropolitan area of Sheffield has a population of 1,569,000.
- Official Language: English (de facto) with 42 languages being spoken in schools, including Urdu, Punjabi, Bengali, Polish and many others.
- GDP Per Capita: $32,546 USD
- Green: Sheffield has the highest ratio of trees to people in Europe – 2.5 million trees in the city.
- Currency: Pound Sterling or Great Britain Pound (£, GBP). As of early 2017, $1 USD = £0.80, €1 EUR = £0.85, $1 CAD = £0.61, $1 AUD = £0.62
Moving and Shipping Costs to Sheffield
Below are some sample container shipping costs to Sheffield from other major world cities. Just keep in mind they only reflect the shipping portion of the cost and not the full moving costs.
- London – £95+
- Australia (Sydney) – £2,248+
- Ireland (Dublin) – £240+
- USA (New York City) – £877+
- Canada (Vancouver) – £1,498+
- New Zealand (Auckland) – £2,646+
- Hong Kong – £527+
- Dubai – £1,682
- Singapore – £879+
Source: WorldFreightRates.com
Housing Costs
The core of Sheffield tends to have apartment blocks and terraced housing. As you move out of the centre, you will find suburbs with more semi-detached and detached houses.
Compared with other major cities in the world, house and flat and flat prices in Sheffield are reasonable. Prices obviously vary from area to area but the figures below will give you an indication of what’s available at what price.
Monthly Rental Prices in Sheffield
- 1 bedroom flat (apartment) in City Centre: £500+
- 1 bedroom flat outside the City Centre: £400+
- 3 bedroom flat in City Centre: £750+
- 3 bedroom flat outside the City Centre: £550+
Sheffield Home Purchase Prices
- Price per square metre (10.7 square feet) to buy in City Centre: £1,700+
- Price per square metre (10.7 square feet) to buy outside City: £1,000+
Sheffield Housing Cost Comparison
This is how rents in Sheffield compare with other cities around the globe.
London is 205.02% more expensive
New York is 343.66% more expensive
Los Angeles is 196.27% more expensive
Toronto is 75.48% more expensive
Sydney is 186.49% more expensive
Paris is 87.26% more expensive
Dubai is 224.45% more expensive
Source: Numbeo
Source: https://moverdb.com/moving-to-sheffield/
Hull


Hull is a city with pulling power, ranked as one of the best locations for businesses in the UK.
A growing city
More than one million people live in the city and its immediate hinterland, with a further nine million people living within a two-hour drive.
The city is characterised by a great quality of life. Its population is rising alongside its economic success as more professionals, families, students, artists and entrepreneurs choose Hull as a place to live, work, invest and create.
Hull is a growing city and is building the houses to enable this growth. The city’s Local Plan will deliver almost 10,000 new homes in the city over the next 15 years.
The city has a young population, with a largest five-year age group at 25 to 29, compared with 45 to 49 nationally. The median age in Hull is 35.
A working city
In 2018, Hull was named the third-most improved UK city as a place to live and work by the Demos-PwC Good Growth for Cities Index 2018, which ranks cities on a combination of economic performance and quality of life. It ranked Hull as the third-most improved city since the 2017 index, behind only Preston and Middlesbrough-Stockton – and ahead of cities such as Birmingham, Liverpool and Manchester.
Employment in Hull is now the highest on record. The city has so far attracted more than £3 billion of investment, creating more than 6,000 new jobs since 2013 in the renewable energy, healthcare, telecommunications, ports and tourism sectors.
Local wages are also growing faster than the national average.
In 2017, Hull was named the most enterprising place in Britain at the Enterprising Britain Awards in recognition of its many programmes put in place to help local businesses to start up and grow.
Knowledge and skills-driven
Hull is known for its first-rate skills in engineering and manufacturing, with more people than ever employed in roles that require a degree or equivalent, and the number of people in apprenticeships at an all-time high.
The Hull and Humber region is also becoming a centre of excellence for energy skills in a collaboration that brings together the best knowledge, experience and facilities to meet industry needs.
The city is home to several world-class research and development (R&D) facilities, including new multi-million pound ventures by RB and Smith & Nephew.
The University of Hull’s academic portfolio contains 50 disciplines across the arts and humanities, business, education, health, sciences and social sciences.
Collaborations are seeing the best knowledge, experience and facilities brought together, including the expansion of the Hull York Medical School to provide more doctors for the region.
Ron Dearing UTC is a government-funded school for 14 to 19-year-olds that combines study for core GCSEs and A Levels with the type of practical, technical and vocational learning and qualifications that employers and universities are crying out for.
Source: https://investhull.co.uk/why-hull/economy
Living in Hull
So you think you know about Hull?
Everyone who lives and works here has got an opinion about the city. But how many people really know the true facts – and the statistics – about everyday life in this neck of the woods? Now Hull City Council has provided a fascinating snapshot of the city, its people and some of the most important social trends as part of a new corporate plan setting out the authority’s priorities over the next five years.
How many people live, work and play here?
Hull is home to 260,200 people, with travel to work population of 515,000. Recent strong growth in the city’s population is due to reducing outward internal migration to neighboring areas such as the East Riding. The city has 119,600 households – growing by more than 400 every year thanks to continued house building.
There are currently 119,800 people in employment – that’s 70.1 percent of the working age population. The figure is the highest on record, improving by over four percent more than the national average over the past five years. Hull is home to over 8,400 local businesses – the highest since 2010 and growing every year since then. According to a September 2017 survey, 71 percent of residents said they were proud to live and work in Hull. The city council is responsible for 24,500 council homes, 19,400 primary school children and 13,200 secondary school children.
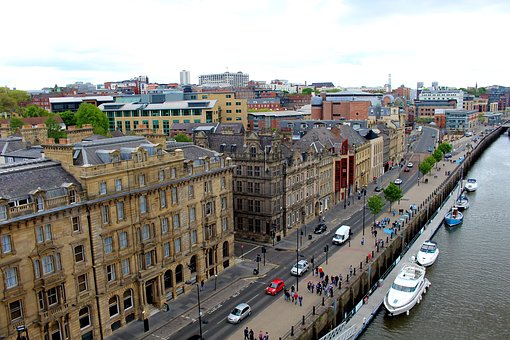
Newcastle


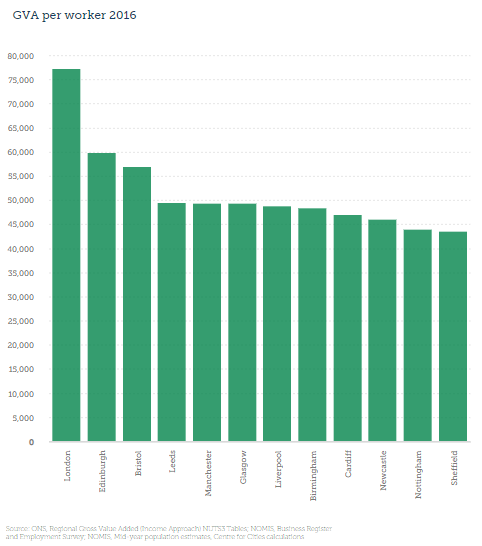
Newcastle Economy
This chart shows GVA per worker – a measure of productivity – in Great Britain’s core cities and capitals. At £45,970, Newcastle is 10th out of 12, some way behind similarly sized port cities like Liverpool (£48,830) and Glasgow (£49,340).
Click to expand.
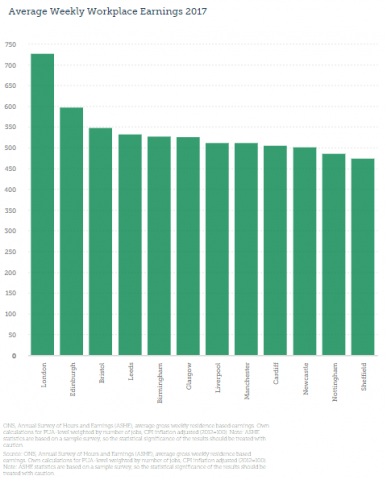
On wages, Newcastle’s ranking is the same. The average weekly wage in Newcastle is £501, compared to £512 in Liverpool and £526 in Glasgow.
Click to expand.
And so it goes on. This one’s exports per job, which you’d want to be high, but which is, in Newcastle, low:
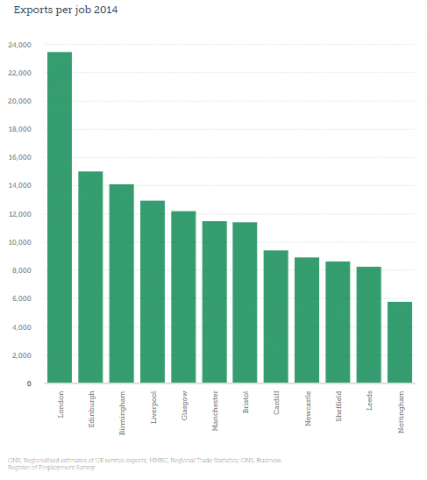
Click to expand.
This one’s claimant count, the percentage of working age people claiming out of work benefits. This time you’d want it to be low, but oh look:
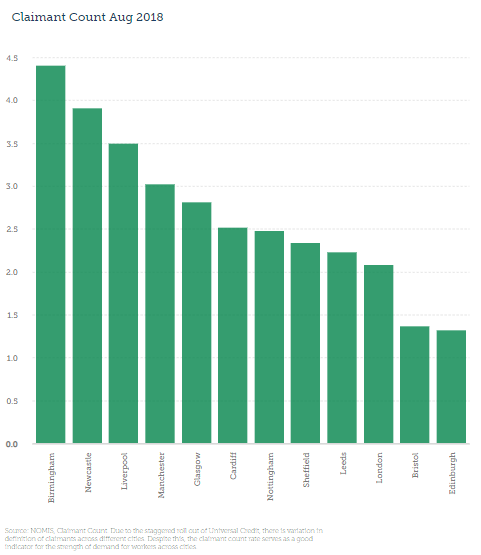
Click to expand.
This trend isn’t universal. On welfare spend per capita, Newcastle is high, but lower than both Liverpool and Glasgow; and its employment rate is actually middle of the pack. But nonetheless, the pattern is clear: even by the standards of post-industrial northern cities, even by the standards of places with similar economic histories, Newcastle is depressed.
And yet, it’s glorious. What gives?
A couple of obvious possibilities spring to mind. One is that blame lies with the type of industries on which Newcastle built its wealth. As far back as the 17th century, it was a port city, which made its money largely from exporting coal to London. Glasgow may also have been hit by the decline of the British shipping industry; but few of the core cities were as dependent on coal-mining, and those that were (Nottingham, Sheffield) generally fared even worse than Newcastle.
Another possible culprit is geography. The big idea in urbanism over the last few years has been “agglomeration”, the idea that a bigger, denser labour market drive productivity. If that’s correct, Newcastle’s relative remoteness may be holding it back: there just aren’t that many people in the North East, and attempts to fold it into programmes like the Northern Powerhouse always felt like a slightly embarrassed afterthought rather than a proper economic development strategy.
But Paul Swinney, the Centre for Cities’ head of policy, and a native of the city’s next door neighbour Sunderland, puts forward another theory for the region’s problems – one found at the intersection of local government and the built environment.
Newcastle, as noted, has many beautiful buildings in its city centre. But that isn’t where the late One North East Regional Develoopment Agency or other similar bodies focused either their efforts or their subsidies, Swinney notes. Instead, the money went largely to out of town business parks like Newburn Riverside, a few miles west up the Tyne.
This had a couple of implications. One is that the presence of subsidised offices in the suburbs undercut the commercial property market in the centre: private developers didn’t develop, because it was harder to make money doing it.
It also had an impact on the type of jobs attracted to the region. Public sector agencies and space-hungry but relatively low-skill industries like call centres moved in; higher wage jobs like finance, tech or business services didn’t. As a result, “In Newcastle, there aren’t loads of people walking round in suits compared to Manchester or Leeds,” says Swinney. “And in Sunderland you struggle to find people in suits full stop: all the jobs are out if town.” If the regional development agency had focused on making the city centres “an attractive place to do business,” he adds, “I think you’d see a slightly different economy.”
To be fair, the city council is now focusing its efforts on reviving the city centre. It’s in the middle of a £45m investment to turn its 50-year old Civic Centre into modern, open-plan office space; once completed, it’ll provide space to rent to other employers, too, and this plus the maintenance savings should bring in £32m over 25 years.
It’s also looking for ways to encourage families to move back to the city centre, says Ged Bell, the Labour councillor responsible for employment policies. It’s looking for ways to bring new industries, such as renewables, to what were once the Tyne shipyards, too. The city council clearly recognises that it needs to make more of that glorious centre than it did in the past – although whether austerity and the dead hand of national government will allow it remains to be seen.
No city deserves to boom: that’s not how economics works. But Newcastle, more than most, seems on the face of it to have all the ingredients that should make for a thriving regional centre. I don’t really know why that’s not how things have played out there. But I can’t help but think that, if we spent more time asking, the UK would be in a better state than it is today.
Jonn Elledge is the editor of CityMetric. He is on Twitter as @jonnelledge and on Facebook as JonnElledgeWrites.
Source: https://www.citymetric.com/business/so-why-isn-t-newcastle-booming-4402
Carlisle
Population
- Carlisle has a population of 108,000, which has increased by 6.7% since 2001, and a working population of 66,000;
- Compared to Cumbria, Carlisle has a comparatively young age profile with a lower proportion of residents in all the ctegories above the age of 49 and higher within the 0-14, 15/29 and 30-34 age groups;
- The District of Carlisle covers an area of approximately 1,042 sq km which gives a density of 103.4 persons per sq kilometre which is an increase of 6.5 persons from the 2001 Census;
- Ethnic minorities within the District account for 5.6% of the population which is more than double the 2011 figure of 2.2%.
Economy
- Carlisle is a free standing city which is not directly influenced by a major conurbation. It is the centre of an economic region serving 500,000 people throughout Cumbria, Northumberland and southern Scotland;
- Carlisle has a prosperous economy which is already home to many international and successful brands, with the employment performance of Carlisle experiencing growth of 4.1% since 2009, outperforming the UK average;
- The wholesale/retail trade provides employment for the largest proportion of the workforce. Employment in non-service industries, such as agriculture, manufacturing and construction are all higher than the national average;
- Key employment sectors in Carlisle include health (16.7%), retailing (11.8%), manufacturing (10.3%) and transport and storage (8.1%);
- Tourism is also of major importance as a generator of economic prosperity and employment. However salaries are lower than the regional average and significantly lower than the national average;
- There has been an 8.2% growth in the working-age group over ten years;
- With skilled trades and process workers representing a higher proportion of the workforce than England and Wales; and
- Unemployment as defined by those claiming Job Seekers Allowance in the District is lower than the national and regional average at 0.7% against 1.4% for the North West and 1.6% for England.
Housing
- Housing Stock as of 31 March 2012 was 50,660.85% being 43,080 are in the private sector with the Registered Providers holding a stock of 7,490;
- The 2011 census had owner occupancy falling in percentage terms with the District being 2 percentage points lower at 69%, Cumbria fell slightly from 72% to 71.2% and the North West from 69% to 65%;
- The percentage split between social rented and private rented has become more evenly split at 15.3%, 14.3% and 18.3% respectively in social rented which is a decrease from 18%, 16% and 20% in 2001] and 15.7%, 14.4% and 16.7% respectively in private rented [which is an increase from 8%, 12% and 8% respectively in 2001]; and
- Affordable Housing completions improved at 31.7% of net overall completions.The number of permissions has remained at a similar level as last year after a significant increase over previous years.
Social
- The English Indices of Deprivation 2010 (which updated the 2007 indices) Carlisle District is 109th out of 326 nationally (with 1 being the highest) with 5 Lower Super Output Areas in the 10% worst nationally which indicates great disparity
- throughout the district and a slightly worsening position from the 2007 indices (ranked 122nd out of 354 nationally)
Health
- Carlisle has Healthy City status, meaning that it is conscious of health and is striving to improve it. The health of people in
- Carlisle is varied with men in the least deprived areas living seven years longer than those in the most deprived areas;
- Several initiatives have been introduced to promote health awareness. Some of the indicators are worse than the national average, whilst others are significantly better. However, death rates from all causes and early death rates from cancer and circulatory diseases being consistently above the England average.
Education
- Educational achievement (measures as 5 or more GCSEs at A* to C grade including English and maths) at 15 years old in Carlisle is lower (52.2%) than both national (59.2%) and regional (59.9%) averages. The District also has a higher percentage of its population with no qualifications at 12.3% compared to the national figure of 9.3%. However in recent years there has been significant investment and restructuring of education services and institutions across the District (see below) and standards are continually improving.
Source: https://www.carlisle.gov.uk/carlisle-business/Why-Carlisle/Area-Statistics
Spectacular Northern Countryside

Item #1