
Montana – Part 5: of my series investigating the immigration possibilities for Entrepreneurs, Individuals, and Families in the USA
![]() Eastwood Licensed Immigration Specialist
Eastwood Licensed Immigration Specialist
![]()
Why not seek out your opportunities for immigration with us. We offer the complete Migration Service for the Entrepreneur from Visa’s to Business plans, market assessments, finding the right location for your business and much, much more. If you are seeking employment we can help you assess the opportunities available and point you in the right direction. If you are a family we can help in locating the right home and schools. All information provided in this blog is advisory and can rely on the third-party source., Over time it will become dated and immigration possibilities will change. So you are strongly advised to make your own checks before taking any action based on any information provided within it.
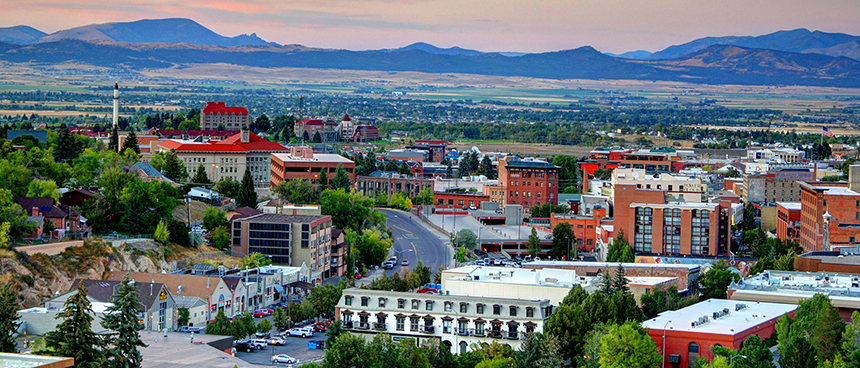
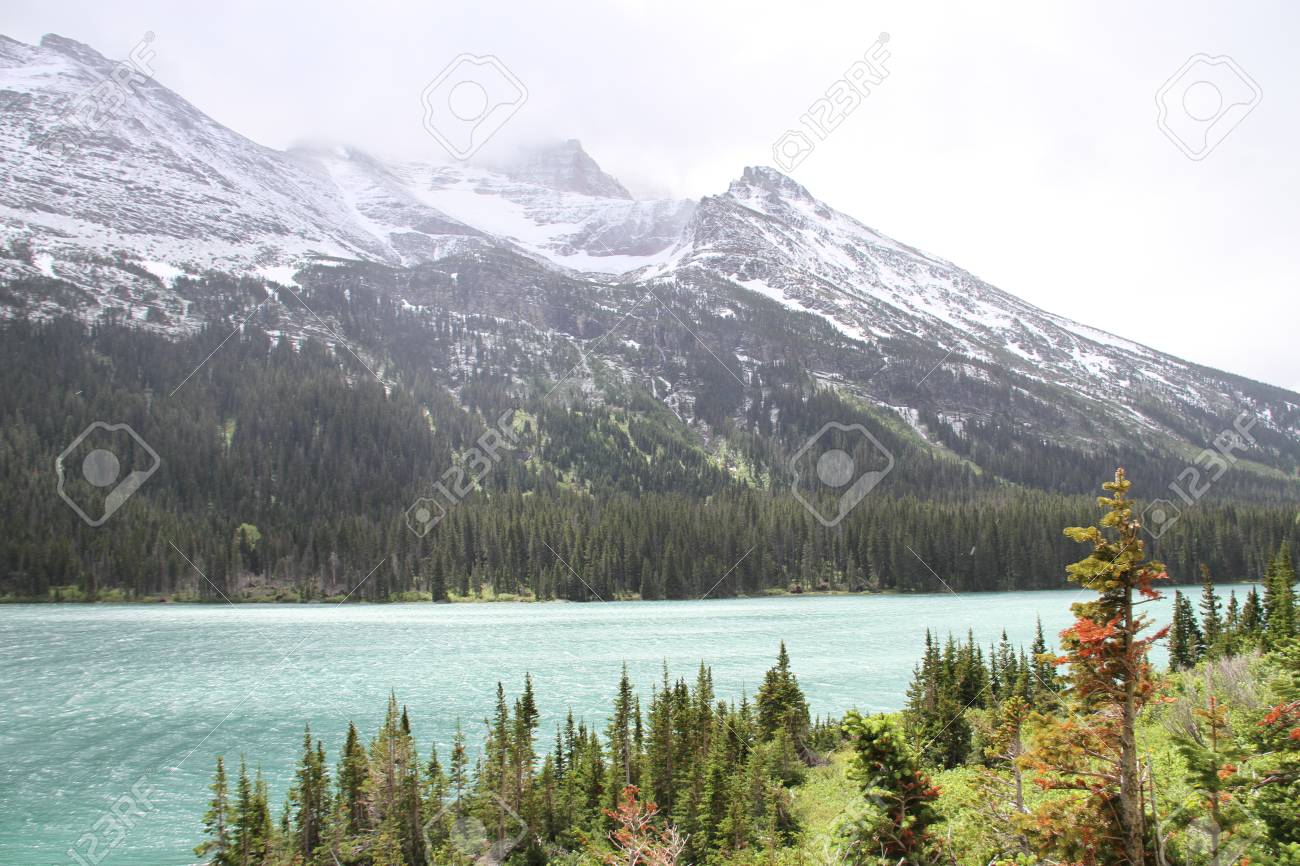
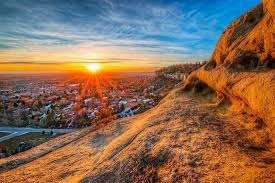
Helena, Montana,
USA Opportunities for Immigration
Introduction
As I write this here in France like many across the world we are heading into the Easter Weekend. A chance for winter-weary Parisians to drop what they are doing and head either for the snow slopes or the sun. So here in the south, it is the quiet before the storm of happy tourists spoiling our peace and quiet. The window from where I am writing looks across to the Cathedral so I am expecting lots of bells and crowds this Friday and Sunday.
I expect most of you will be sitting on a beach to read this. So I thought I would start by giving you some very useful facts about Montana such as, ‘ North of Missoula is the largest population of nesting common loons in the western United States’. This was an education for me as the last time I heard anyone speak about ‘Loons’ they were describing brightly colored very cheap flared jeans popular in the early 1970s, that decade of fashion highs. So to hear they were nesting in large numbers was a worry. It was, however, a delight to read that the ‘Brits’ were here and grabbed the loot before anyone else arrived with the information that,’The Montana Yogo Sapphire is the only North American gem to be included in the Crown Jewels of England’. Leopards, or should I say Lions never change their spots. How embarrassing can you get?
The best fact of all or rather two best facts are: Montana has the largest migratory elk herd in the nation and the average square mile of land contains 1.4 elk, 1.4 pronghorn antelope, and 3.3 deer. It sounds like its north of the ‘Wall’ (Game of Thrones) to me. In all seriousness it is hard to think of any other country in the west that could make such a claim for one of its states, a state that has a thriving economy, and a lifestyle to be dreamed of. Montana certainly has a lot to offer the discerning immigrant.
Facts source: https://www.50states.com/facts/montana.htm well worth a visit.
Montana on the Map
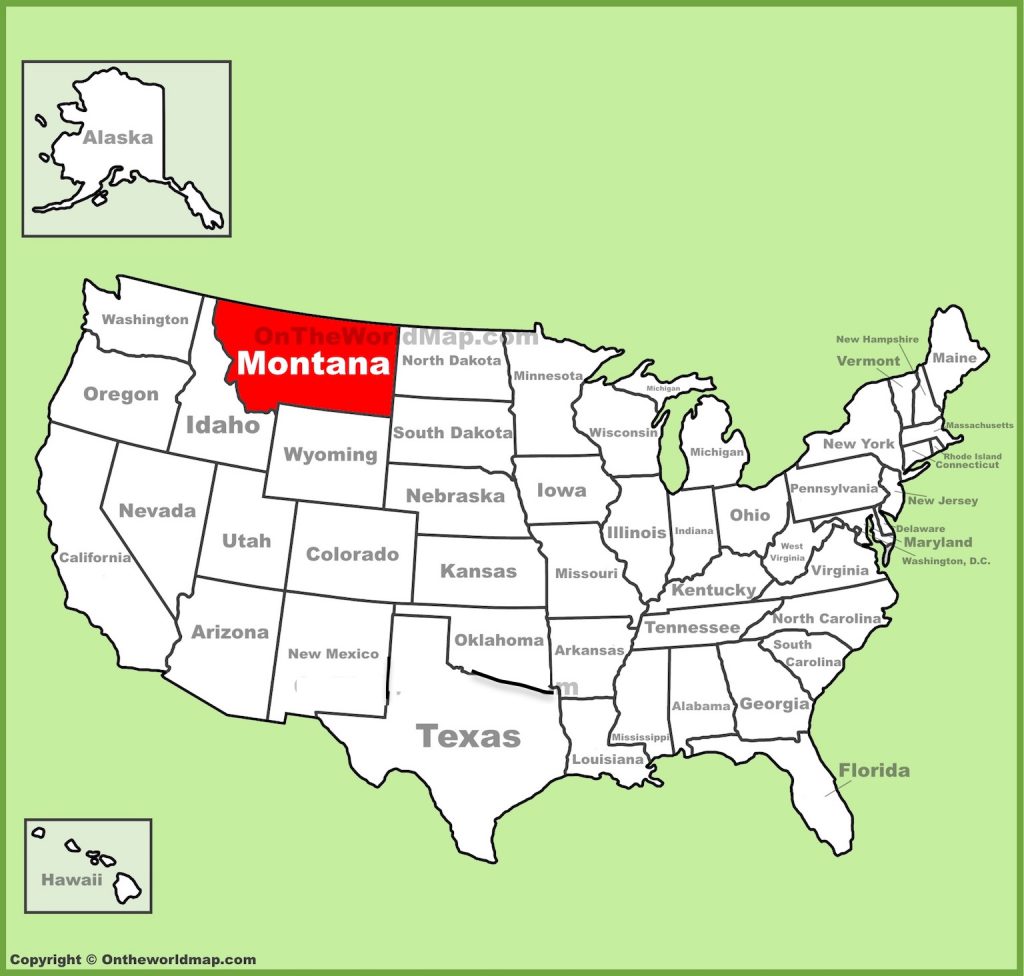
State of Montana, USA
Immigration Opportunities
QUICK FACTS
Real Estate: For SaleFor Rent
Country: United States
State: Montana
County: Yellowstone, Missoula, 56 total
Metro Area: Billings, Missoula, 7 total
Political Ideology: Strongly conservativeSchools: See Local SchoolsCity: Billings, Missoula, 363 total
Zip Codes: 59901, 59102, 59101, 59715, 59701, 59718, 59801, 59405, 59105, 59601,361 total
Source:
https://www.bestplaces.net/state/montana
An Older Map
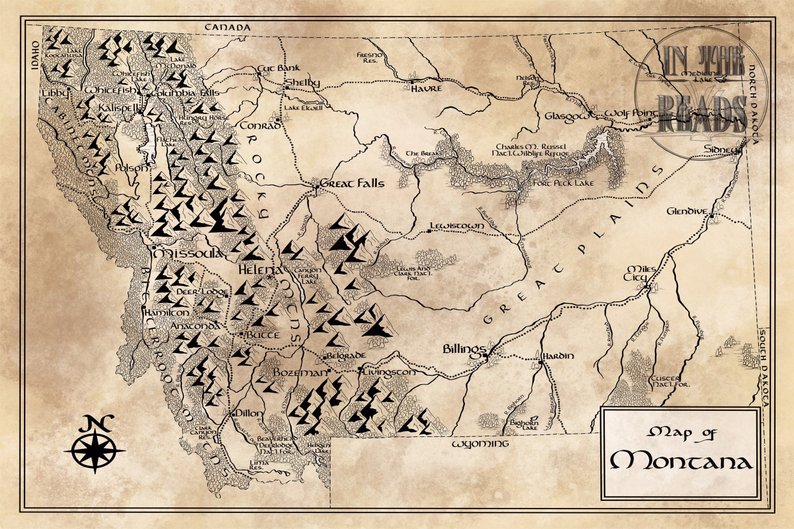
State of Montana, USA
Opportunities for Immigration
Montana Immigration
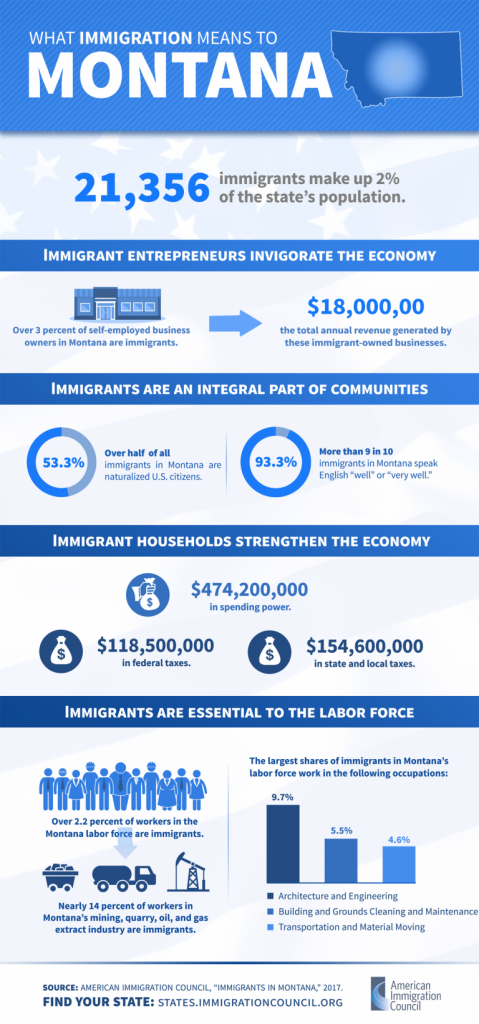
It’s not hard to understand why Montana is so welcoming to immigrants. In 2015 1,891 immigrant business owners accounted for 2.1 percent of all self-employed Montana residents and generated $18 million in business income. Also, Montanans in immigrant-led households had $474.2 million in spending power (after-tax income) in 2014. Not only that but Immigrant-led households in the state paid $118.5 million in federal taxes and $36.1 million in state and local taxes in 2014. Such levels of contributions cannot be ignored nor the increase in employment opportunities they have created for all Montana’s residents.
Montana Research
Opportunities for Immigration
Montana has a small but growing immigrant community, much of which emigrated from Canada and Mexico. While only 2 percent of Montana’s population was born in another country, foreign-born residents help support Montana’s economy across sectors. Immigrants make up a vital, educated share of the state’s labor force, with over a third holding a college or higher degree. Many of Montana’s immigrants lend their expertise as architects and engineers, accounting for 10 percent of residents working in the field, and roughly 14 percent of all Montanans working in the extraction industry are immigrants. As workers, business owners, taxpayers, and neighbors, immigrants are an integral part of Montana’s diverse and thriving communities and make extensive contributions that benefit all.

Montana Legal Profession
Opportunities for Immigration
More than 2 percent of Montana residents are immigrants, while 4 percent are native-born U.S. citizens with at least one immigrant parent.
- In 2015, 21,356 immigrants (foreign-born individuals) comprised 2.1 percent of the state’s population.
- Montana was home to 11,065 women, 9,033 men, and 1,258 children who were immigrants.
- The top countries of origin for immigrants were Canada (26.7 percent of immigrants), Mexico (12.5 percent), Germany (7.2 percent), England (5.7 percent), and Korea (4.4 percent).
- In 2016, 44,815 people in Montana (4.4 percent of the state’s population) were native-born Americans who had at least one immigrant parent.
Over half of all immigrants in Montana are naturalized U.S. citizens.
- 11,373 immigrants (53.3 percent)had naturalized as of 2015, while 5,217 immigrants were eligible to become naturalized U.S. citizens in 2015.
- More than 9 in 10 immigrants (93.3 percent) reported speaking English “well” or “very well.”

State of Montana, USA
Opportunities for Immigration
Most immigrants in Montana have pursued education at or above the college level.
- More than one-third of immigrants had a college degree or more education in 2015, while one in seven had less than a high school diploma.
Information source: https://www.americanimmigrationcouncil.org/research/immigrants-in-montana
Montana’s Economy
Montana’s economy has been outperforming the national economy since the turn of the century, including having better performance during the 2007 recession and a faster, stronger economic recovery exiting the recession.
Montana’s outperforming economy is evidenced in nearly every economic metric: Montana’s unemployment rate has been lower than the U.S. unemployment rate since the 2001 recession and has remained about 1.5 percentage points lower than the U.S. rate throughout 2014.
Montana has the 8th fastest GDP growth among states over both the last five years and ten years (ending in 2013), and Montana’s GDP growth was faster than the U.S. average in every year since 2000, except for 2012.
Montana’s personal income growth has also outpaced the national average, ranking as the 6th fastest over the last five years and 7th over the last ten years. Montana has the fifth fastest wage growth among states for both the five and ten year timeframes. Montana’s economy is healthy, posting above average job growth and improvement in all economic indicators.
However, not all areas of the state have performed equally. In general, the Eastern region has posted rapid economic growth in the past decade, with the rapid expansion of employment and rising wages for many counties affected by the development of the Bakken oil fields.
Many counties in the eastern edge of the state have experienced the very low unemployment rates indicative of worker shortages. The Northwest and Southwest regions of Montana experienced strong growth leading up to the recession, but the concentration of construction and wood product manufacturing employment resulted in significant contraction during the national recession.
Both the Northwest and Southwest regions lost over 8,000 jobs during the recession. While the Southwest region rebounded quickly, the Northwest suffered through an extended recession and still has elevated unemployment rates.
Montana’s seven reservation areas also posted economic growth for the last decade, but remain some of the most economically sensitive areas of our states, often with unemployment levels two to three times higher than their surrounding regions. The graphic below illustrates the 2013 unemployment rates in the five labor market areas of Montana, along with the seven reservation areas.
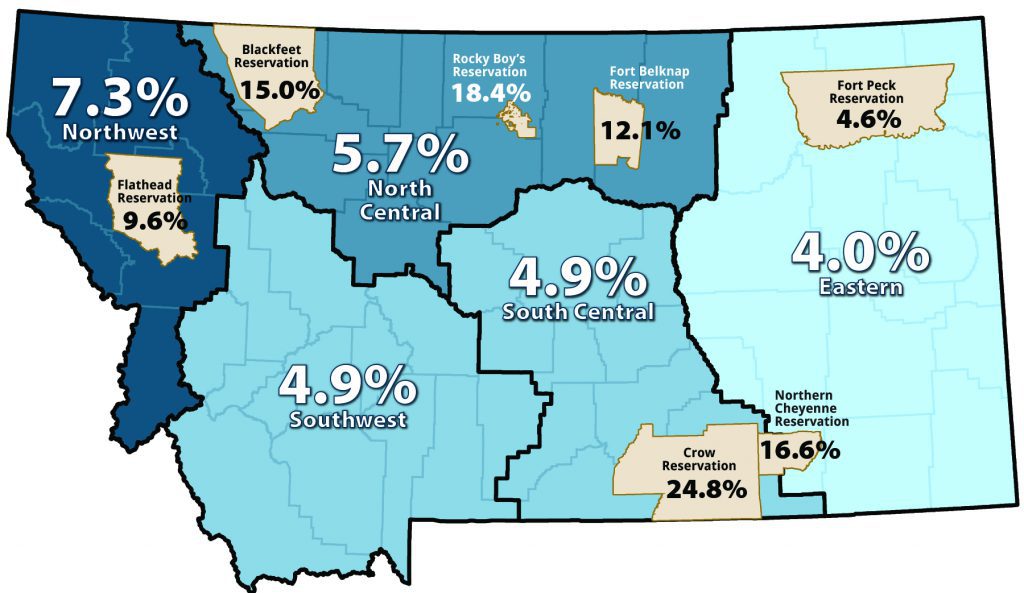
2013 Unemployment Rates in Five Labor Market Areas and Seven Reservations
Montana’s strong economic growth has not yet been enough to raise Montana’s wage and income levels up to the national averages. With an average annual wage of $37,575 in 2013, Montana ranked 47th among states in average wages in 2013, ahead of only Idaho, South Dakota, and Mississippi.
Montana performs better comparatively in terms of income, ranking 35th for personal income per capita among states. Personal income includes income from business ventures, rental payments, royalties, social security, government transfer payments, and other sources in addition to wages.
Montana’s high rates of entrepreneurialism and business ownership improve our rankings for income compared to wages
Montana is in this position of low wages and income compared to other states partially because of the slow income growth in the last half of the 20th century. Figure 2 compares real per capita income in Montana and the U.S. using all available data back to 1929.
Per capita income measures the total amount of income received in the state divided by the population, providing a measure of relative wealth that can be used to compare to other areas.
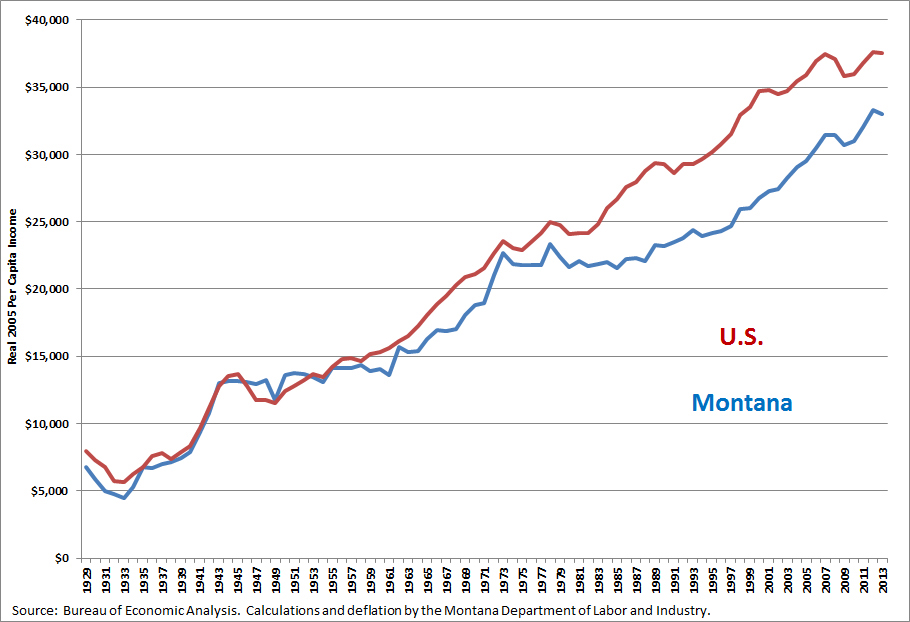
Comparison of Montana and U.S. Real Per Capita Income in 2005 Dollar
The above illustrates that per capita income was relatively equal in Montana and the U.S. from 1929 to about 1952, with Montana’s per capita income being higher than the U.S.’s per capita income for a short period from 1946 to 1952.
Montana’s Economic Growth
From 1952 to 2000, the U.S. per capita income rose faster than Montana’s, creating the large gap in income levels that our state is now trying to overcome. However, Montana has been on the right path since 2000, with wage and income growth faster than the national average, narrowing the gap between Montana’s and the U.S. per capita income levels.
It is difficult to isolate one cause for the slower growth of Montana’s economy during the second half of the 20th century. Some economists contribute the decline to “the natural resource curse,” which is a phenomenon where economies concentrated in natural resource industries (such as agriculture, mining, and petroleum refining) have slow long-term growth rates despite the infusion of capital into the economy from natural resource development.
Other economists note the slower growth in the early 1980s corresponds with the closure the copper mine and smelter in the Butte and Anaconda area. Even others point to the slow adoption of computers and technology in the Montana economy compared to the more rapid adoption in the U.S. economy during the 1990s.
The adoptions of desktop computers and technology advancements in the 1990s resulted in large productivity gains for the U.S. economy, driving up workers’ wages and income levels. Some data suggests that Montana lags behind other states in the adoption and use of technology, and as a result, has lower productivity levels than other states. In actuality, all or none of these factors could have slowed Montana’s growth in the latter half of the 20th century.
Diversification of the Economy
The diversification of Montana’s economy over the last sixty years has also influenced the composition and performance of Montana’s economy. Figure 3 illustrates the changing roles of industries in the composition of Montana income since 1930. Like the U.S. and other developed countries worldwide, Montana has become more of a service-based industry over time as consumers have demanded more services than goods. The goods-based industries of manufacturing, construction, mining, and agriculture now comprise about 24% of Montana’s personal income derived from work. The goods-producing industries are still expanding in terms of the value of their products, generally increasing production value in real terms over time, but their share of the overall economy has shrunk because the service-based industries are growing at a faster rate than the goods-based industries. This trend is expected to continue as Montana builds its post-industrial economy.
Figure 3: Share of Montana Personal Income by Industry
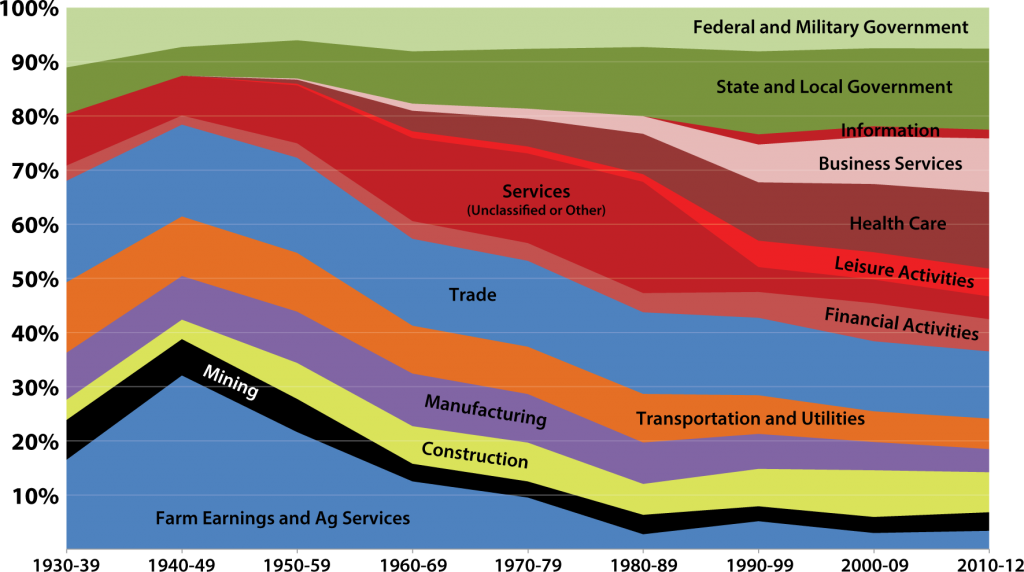
Share of Montana Personal Income by Industry
Although the service-based industries are often described as low-paying industries with undesirable jobs, like retail or tourism jobs, the service sector also includes high-paying, high-skill jobs that require advanced degrees, such as those in the professional services, health care, or financial services industries.
Service-based Industries
Service-based industries also contribute to Montana’s exports, bringing new money into Montana from the sale of their services, and make a sizable contribution to our state’s GDP. For example, financial activities is a service-based industry that includes banks, investment firms, and insurance agencies. In 2013, the average wage for the industry was over $55,000, and the industry provided 17.3% of Montana’s total GDP – more than any other industry.
In general, greater economic diversification is associated with faster and more stable economic growth in the long-term. The movement towards the service-based industries has increased demand for well-educated, high-skilled workers, especially in industries like professional services and health care. While it is difficult to directly compare the rate of diversification, Montana’s economy may have lagged behind the national economy in the movement to a service-based industry, which could have contributed to the lagging income growth in the second half of the 20th century.
In terms of the current industry mix, there are some differences in the types of industries in Montana compared to the U.S. that may help to explain wage differences. However, the differences are too minor to fully explain the lower wages in Montana or the cause of the lagging growth over the last half-century.
For example, when compared to the U.S., Montana has a slightly higher concentration in the lower-paying industry of leisure activities (which includes many tourism type businesses such as hotels, bars, restaurants, and ski resources), and a lower concentration in the high-tech, high-paying professional services industry. The differences in these industry concentrations could be used to explain Montana’s lower wages.
But there are also industry mix differences that would suggest that Montana should have higher wages than the U.S., such as Montana having a higher concentration than the U.S. in mining and healthcare, both high-paying industries.
Figure 4 illustrates Montana’s 2013 industrial composition using three different economic metrics – GDP, work earnings, and employment to help demonstrate the relative size of Montana’s industries and the differences in how each industry contributes to the economy.
Financial activities was the largest industry for GDP, followed by the government and trade sectors. GDP measures the overall value added by the industry for economic activity, and can be thought of as the value of sales minus the costs paid for non-labor inputs. Wages earned by Montanans are included in GDP because they represent the value of economic activity added by workers to the production of goods and services in Montana.
Montana’s Manufacturing Industries
Compared to the U.S., Montana has a much smaller share of manufacturing (12.5% in the U.S. compared to 7% in MT). However, larger concentrations in agriculture, mining, and construction make up this shortfall, leaving the goods-producing industries in Montana as roughly 24% of GDP (slightly higher than the 20% of U.S. GDP that lies within the goods-producing sectors).
Montana’s manufacturing is likely stymied by the long distance from Montana to major consumer cities and ports, which increase transportation costs for manufactured goods. The transportation sector comprises a larger share of Montana’s economy compared to the U.S., likely because Montana’s large size and rural nature require a lot of transportation to ship our goods to consumers. Montana’s share of health care is larger than the U.S., partially due to Montana’s older population (the demand for health services increases as a person ages).
However, only work earnings (workers’ wages, benefits, and proprietor earnings) can be assigned to an industry, so other types of personal income are not included in Figure 4. The largest industry in terms of personal income earned from work (work earnings) is health care and education, along with government and trade.
Health, Trade & Leisure
Finally, the largest private industries in terms of employment are health care, trade, and leisure activities. These three industries combined employ nearly 45% of Montana’s workers. Government is also a large employer with roughly 18.8% of employment, most of whom are employed by local governments.
Employment represents the primary way that the benefits of economic growth are distributed through the economy, with most Montanans receiving their income from wages instead of capital rents like dividends or royalties. GDP, personal income, and employment all equally measure important elements of the Montana economy, just like all industries are important to the proper functioning of the Montana economy. All industries work together to create a dynamic economy.
Conclusion
In conclusion, Montana’s economy is performing well, gaining ground on the national average in terms of wages and personal income because of rapid growth. Continued growth faster than the U.S. average is needed to regain our competitiveness with other states in terms of per capita income and higher wages, which was lost over a long period of lagging growth in the second half of the 20th century.
A number of changes occurred in both the U.S. and Montana economies during this time, making it difficult to determine why Montana’s economy experienced this extended period of slower growth. Diversification into a more service-based economy likely accelerated wage growth in both the U.S. and Montana. Lagging diversification and differences in industry mix between the U.S. and Montana may present partial answers, but they are not the full explanation.
Much to the chagrin of policymakers and economic developers, Montana’s economy is influenced by an infinite number of factors, many of them that are outside of our control. However, it is within our control to ensure that Montana’s businesses and workers are responsive to economic changes and prepared to navigate an ever-changing global economy.
This preparedness can be achieved by ensuring our workers have the education and training needed to adapt, prosper, and innovate in whatever situation is presented in the future. In this way, our workforce can become more productive, earning higher wages and greater profits for the Montana economy.
Source:Department of Labor and Industry, Research and Analysis Bureau; Author: Barbara Wagn
Source: https://mslservices.mt.gov/legislative_snapshot/Economy/Default.aspx
Montana has an unemployment rate of 3.8%. The US average is 3.9%.
Montana has seen the job market increase by 0.1% over the last year. Future job growth over the next ten years is predicted to be 28.2%, which is lower than the US average of 33.5%.
Tax Rates for Montana
– The Sales Tax Rate for Montana is 0.0%. The US average is 7.3%.
– The Income Tax Rate for Montana is 6.9%. The US average is 4.6%.
Income and Salaries for Montana
– The average income of a Montana resident is $25,977 a year. The US average is $28,555 a year.
– The Median household income of a Montana resident is $46,766 a year. The US average is $53,482 a year.INCOME BY POPULA
Source: https://www.bestplaces.net/economy/state/montana
Population and Cities
Montana is one of the least populated states in the U.S. Its population of 1,052,343 puts it at 44th in terms of population when compared to the other states. Not surprisingly, there is just one city that has a population of over 100,000, which is Billings. As of 2017, this city had a population of 110,263. Coming in second place is Missoula, with a population of over 71,000, followed by Great Falls with a population that’s approaching 60,000 inhabitants. In total there are six cities in Montana with populations of at least 10,000, which includes Helena, the state capital.
There are a total of 129 incorporated municipalities that are designated as cities or towns. These are spread across the state’s 56 counties. Breaking this down further, Montana divides its cities into three different classes: First Class, Second Class, and Third Class. First Class cities have populations of over 10,000, Second Class cities have populations between 5,000 and 10,000, while Third Class cities have populations between 1,000 and 5,000. An increase or decrease in population can lead to a change in classes. Looking at individual municipalities, Ismay in Custer County is the smallest town with a population of just 19 inhabitants, while the smallest city is Judith Gap in Wheatland County, with a population of just 126 people.
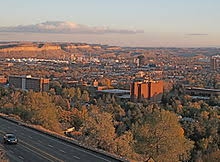
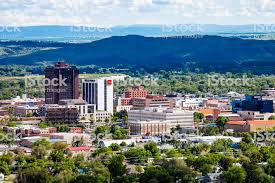
Billings Montana
Billings is a rapidly growing city because it did not face the economic downturn that affected the rest of the United States, and the discovery of oil has made this a prosperous area.110,668. It is a city located in Montana. It is situated in Yellowstone County and serves as the county seat. The city has an estimated population of 110,323, making it the biggest city in Montana by population. It is the only city in the state with a population of more than 100,000, and it continues to show steady growth.


Billings History
Billings has a very long history, with the discovery of artifacts showing that the region has been inhabited since at least 2600 BCE. The first known inhabitants were the Crow Indians, who inhabited the area beginning in 1700.
The region was originally known as Clark’s Fork Bottom, which served as a hub for hauling freight. In 1877, settlers formed the town of Coulson, the first town in the Yellowstone Valley. A sawmill, general store, and trading post were opened when the town was first established. It began to grow and so other buildings and tents were erected to keep up with the population.
In its earliest occupied years, Coulson was a Wild West Town – their Sheriff’s nickname was “Liver-Eating” Johnson and many arguments ended in gunfire and a burial in Boothill Cemetery. The residents hoped the land would be near enough to the tracts of land that the railroad would help them grow as quickly as they intended to. The railroad came to the region shortly after and residents in Coulson believed that it would bring significant growth. However, the railroad company decided to create a new town nearby named Billings. The residents of Coulson eventually moved to the town of Billings, leaving Coulson to eventually become part of Billings in the 1930s. The park known as Coulson Park marks the original area of settlement.
The city of Billings was founded officially in 1882. The town only had three buildings but soon had over 2,000 less than one year after it was founded. In the early 20th century, Billings’ population grew to over 10,000. The city was one of the fastest-growing in the U.S – and even earned the nickname – “Magic City” – due to its incredible growth rate. Oil fields were discovered in the state, followed by natural gas and coal reserves made the city a center of energy and boosted the economy.
When World War II ended, the city diversified by becoming the center of finance, medicine and culture. The population continued to grow. Through the 1970s, Billings continued to be a leader in the energy sector. The city also saw major growth through its downtown area during this time and through the 1980s, including the construction of Sage Tower and Granite Tower.
Billings continued to expand with the addition of shopping centers, malls, business parks, and hotels through the 1990s. This growth has continued through the 21st century as more business parks are open and the downtown area has been updated with new buildings, a transit center and parking garages. The economy has also remained strong, making Billings a desirable city for many residents.
Billings Demographics
Billings has an estimated population of over 110,000. This shows significant growth from the 2010 census figures that show a population of 104,170. The city is 43.52 square miles and has a population density of 2,400 people per square mile.
Missoula
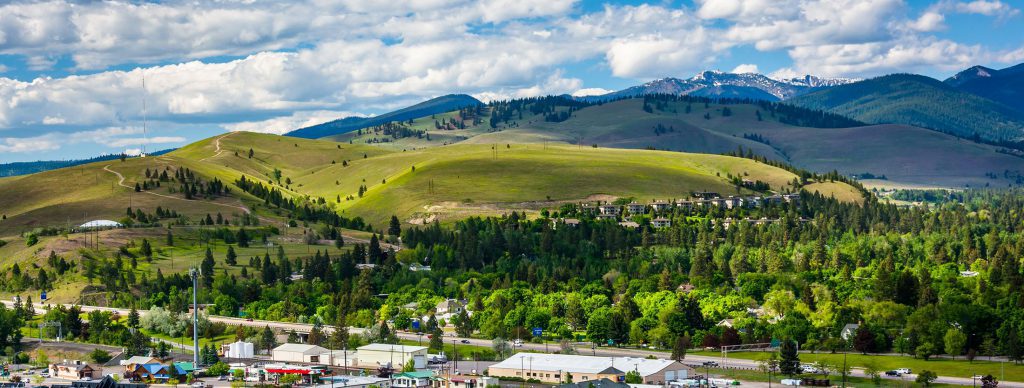
Missoula Montanta USA
Opportunities for Immigration
| MissoulaFive mountain ranges meet in Missoula, earning it the nickname Hub of Five Valleys.76,771 Missoula is a city located in the state of Montana. It is located in Missoula County, where it is the county seat. With an estimated population of 72,072, Missoula is the second largest city in the state. Missoula History Evidence shows that the area that is now Missoula was first inhabited about 12,000 years ago. In the 18th century, the area was primarily inhabited by native tribes including the Shoshone, Blackfeet and Salish. The first citizens of the United States came to the area during the expedition of Lewis and Clark of the 19th century, where they camped nearby during their westbound trip and their return. In 1860, Hell Gate Village was established by Frank Worden and Christopher Higgins. It was initially located about five miles west of the current-day downtown area, but the need for a water supply led to relocation just four years later. Missoula Mills was established in 1866 and was the county seat. Fort Missoula was established during the next decade to offer protection for settlers. The area continued to grow when the Northern Pacific Railway arrived and during the same year, Missoula was designated as a town. Many sawmills were opened during this time period because of the need for lumber to construct bridges and railways. This launched the city’s lumber industry, which was an important part of the economy through the 20th century. Logging was a primary industry throughout the mid-20th century with the opening of the Hoerner-Waldorf pulp mill, although the pulp mill seriously impacted the air quality. However, the lumber industry was affected by a recession in the 1980s, which led to the city focusing on other industries. Today, education and health care are the primary drivers of the economy. The University of Montana is a higher education institution that has been expanded and renovated significantly in recent years. The city’s hospital, St. Patrick Hospital and Health Sciences Center was founded in 1873 and has since gone through several expansions. Missoula Demographics Missoula has an estimated population of over 72,000 people. Spread across over 29 square miles, the city has a population density of 2,300 people per square mile. |
|
| Great FallsGreat Falls is the location of five waterfalls, and with the addition of hydroelectric dams to these falls, the city is nicknamed Electric City.58,068 | |
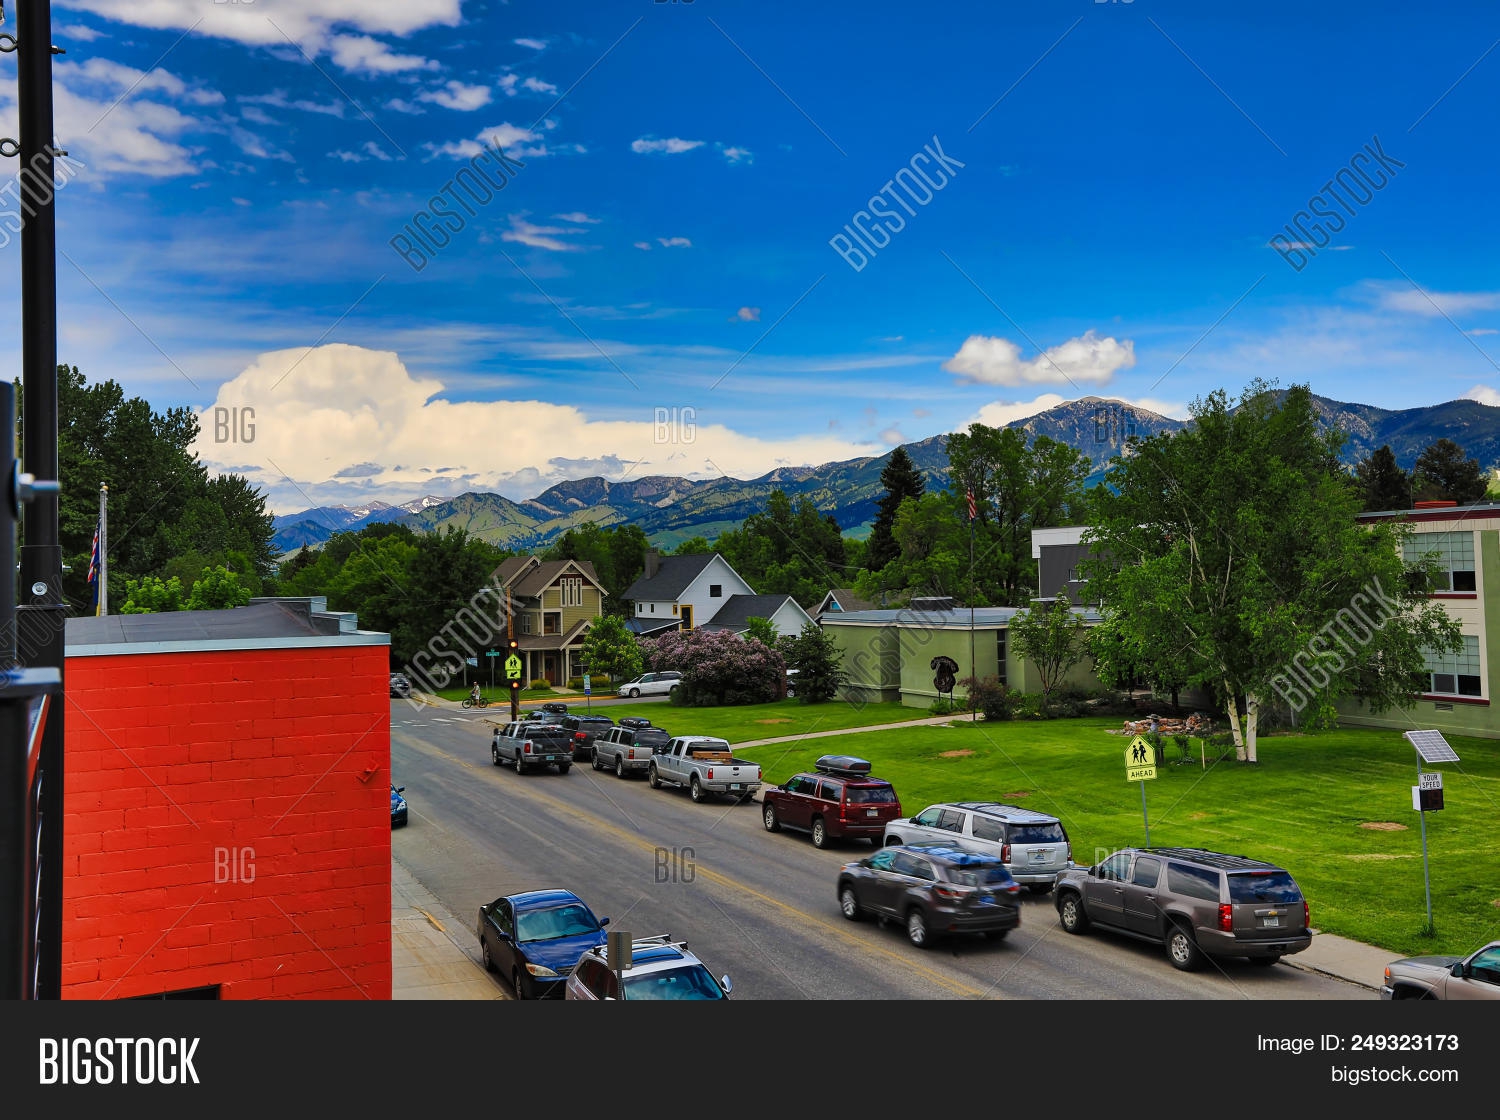
| BozemanBozeman — which was founded in 1864 and incorporated as a city in 1883 — is the home of Montana State University.50,803 | |
| HelenaHelena became one of the wealthiest cities in the U.S. after billions of dollars in gold was discovered here.32,843 | |
| KalispellKalispell is the largest city in the northwestern region of the state.24,951 | |
| HavreThis city was originally known as Bullhook Bottoms.9,978 | |
| Miles CityTubing in the Tongue River is a popular activity for residents and visitors.8,176 |
Want to find out more about emigrating to the USA?
Are you looking for USA Visa details? Check out our US Visa page for personal and business immigration information:
https://egbmg.com/services/usa-business-visas/
Are you looking for a quick overview of the USA Economy and business? Check out our USA Business Page for a quick overview:
https://egbmg.com/business-in-the-usa/